I find that people often seem to have trouble understanding how an unlikely event can occur. I have heard people ascribe supernatural causes to such events, and I have also heard people express incredulity at the event occurring at all. This is one of many ways in which probability can be counterintuitive. We usually expect likely things to happen, and usually likely things do happen.
Not all unlikely events are the same. There are different ways in which an event can be unlikely, and different reasons with which it can be explained. In some cases, there are specific psychological reasons for attributing meaning to unlikely events and coincidences. Unlikely things happen all the time, but we selectively notice patterns. This pattern-seeking behavior is hugely advantageous for us. However, it can also lead to superstition. We are also subject to confirmation bias, and so on.
My present goal is not to discuss these psychological factors, but rather to explain through probability theory why unlikely events occur. This is, firstly, a response to incredulity by establishing that these events do occur, and secondly, a response to mystical interpretations by offering a naturalistic explanation.
The axiom of unit measure (or Kolmogorov’s second axiom of probability)
One of the axioms of probability theory states that the probability over of the entire space of possible outcomes must be 1. In other words, the outcome of an event must be one among the possible outcomes. In a classical coin flip, we say that the two possible outcomes are heads or tails. When we flip the coin, then, it must land on heads or tails. In real life, a coin can land on its edge, as well as fail to land at all. When modeling a real world situation mathematically, we must be careful to consider the possibilities and especially which possibilities are important for what we want to do. In many cases, it makes sense to disregard unlikely outcomes. For example, suppose you flip a coin to decide what to have for dinner. You’re only concerned with the outcomes of heads or tails, and if anything else happens whatsoever, you can just do the coin flip over again.
Many situations occur in which every outcome is equally likely, but there is a large number of possible outcomes. This makes each individual outcome very unlikely. For example, if 1 million people buy lottery tickets, each person only has a 1 in 1,000,000 chance of winning. However, by the axiom of unit measure someone has to win. Similarly, when being randomly dealt a 5-card hand from a 52-card deck, the odds of being dealt that particular hand is 1 in 2,598,960. In an even more extreme example, there are 52! or
80,658,175,170,943,878,571,660,636,856,403,766,975,289,505,440,883,277,824,000,000,000,000
possible ways a deck can be randomly shuffled. That’s nearly 1068. This number is beyond astronomical. If you randomly shuffle a deck of cards, you will never encounter a deck of cards arranged exactly in that order again in your life. No human ever will, even given billions of years. You can be almost completely certain. Such an occurrence is incomprehensibly unlikely, and yet an event so unlikely had to happen, since randomly shuffling a deck must give you one of the 52! card orderings.
Granted, human shuffling is not truly random.
The law of truly large numbers
Lotteries and deck shuffling have uniform probability distributions, in which all outcomes are equally likely. Many things in nature have normal probability distributions, meaning the outcome probabilities form a bell curve. The law of large numbers states that, after a large number of trials, the average empirical outcome will approximate the theoretical most likely outcome (the mean, or peak of the bell curve).
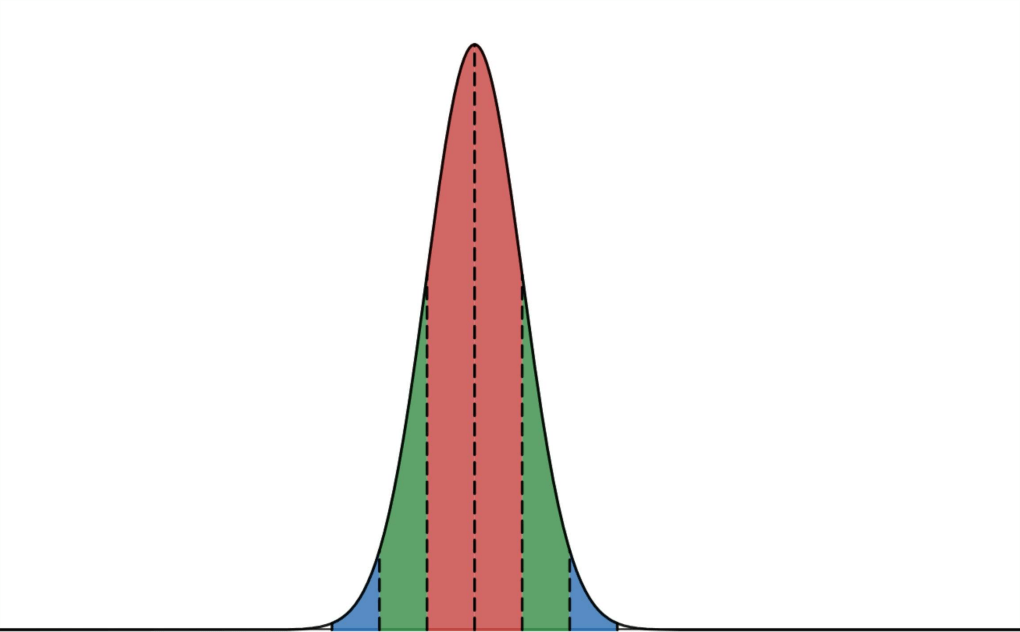
The 68–95–99.7 rule, also known as the empirical rule, describes the percent of a population within x standard deviations from the mean in a normal distribution. This rule is an easy-to-use simplification of the function that gives these values:
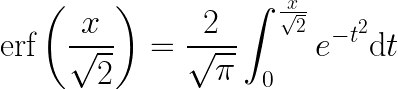
This integral provably cannot be simplified, so we use numerical approximations. About 68% of the population lies within 1 standard deviation of the mean, about 95% lies within 2 standard deviations, and about 99.7% lie within 3 standard deviations.
The size of one standard deviation is related to the variance of the dataset. Variance is a measure of how spread out or clustered around the mean the data is.

erf(2/√2) ≈ 0.95
erf(3/√2) ≈ 0.997

vertical axis: percent of dataset included
Beyond 3 standard deviations from the mean is often treated as “virtually 100%.” However, let’s consider the probability of an outlier 6 standard deviations from the mean. This has about 1 in 1 billion odds. Plenty of events occur many more times than that. The global human population is about 8 billion people. There are several billion credit card transactions per year in the US alone. Our galaxy is estimated to have at least 100 billion stars. There are about 3 trillion trees in the world. That means that we would expect there to be around 3,000 trees to be 6 standard deviations from the norm of whatever normally-distributed property we’re measuring.
This principle is the law of truly large numbers: after a large enough number of trials/observations, even the most unlikely outcome can occur. One way of thinking about unlikely events is, how likely is it to avoid that outcome after such-and-such many trials/observations? We will use this in the following example.
The birthday paradox
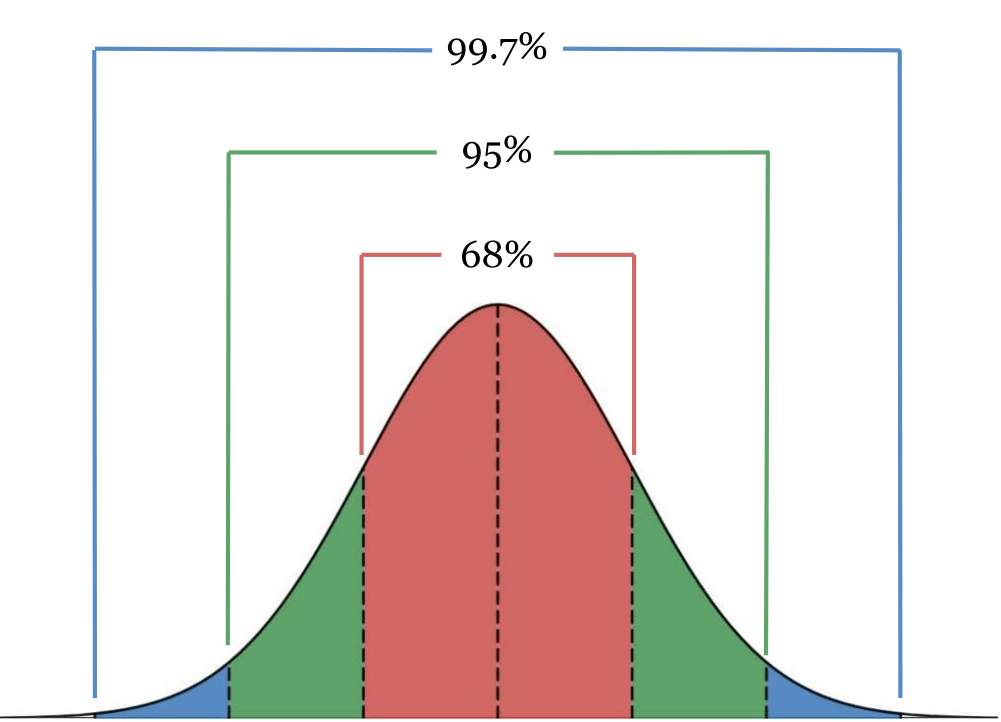
You may have heard about this one before. If you run into a random person in the street, the probability of having the same birthday as them is very small. If you’re in a room full of people, what’s the probability of any pair having the same birthday? It is a perhaps surprising or counterintuitive fact that in a room with just 23 or more people, it’s more likely than not that there is a pair that share a birthday.
This isn’t strictly true. Most rooms full of people are not random, and even in a perfectly random sample of the population, the fact that there are twins, leap years, seasonal trends in birthrate, etc. complicate the probability. However, the 23 number seems to be an empirically good approximation, so we can set aside these complications. Let’s assume no leap years, completely random birthdays, and so on.
Let’s think a little more deeply about this. If the room had 366 people in it, then we would be guaranteed a shared birthday, since there are only 365 options. This is the pigeonhole principle. If we have 365 people, there is only one way that there could be no shared birthdays, namely if each day of the year is exactly one person’s birthday. On the other hand, with those 365 people, there are more than a googol (10100) possible ways there could be at least one shared birthday. It would be very unlikely (this is an understatement) to randomly get no shared birthdays.
Next, let’s consider 364 people. If each person is born on a different day, then that leaves one day of the year that’s no one’s birthday. The day that’s no one’s birthday could be any day of the year, so that means there are 365 possibilities. That’s 365 ways that 364 people could have zero shared birthdays. That’s a lot more than 1, but still a lot less than 10100. We see as we keep subtracting people that it gradually becomes less likely that at least two people have the same birthday. It keeps decreasing this way until we get to two people, where the probability of a shared birthday reaches its minimum at 1/365 or approximately 0.00274. It might be surprising to see such a large number become small in so few steps. It happens to be the case that 23 people is where this probability is just over 0.5.
Summary
Coincidences are not only to be expected, they are unavoidable. The rate at which “astonishingly unlikely” events occur is perfectly consistent with what we would expect mathematically. Despite the profound psychological effect of highly improbable coincidences, it is irrational to attach any significance to them. One example of this is an argument for Intelligent Design (a form of rebranded creationism): that the mutations and other circumstances that enabled evolution to take place are just too improbable and thus must have been divinely guided. There are multiple issues with this argument, but most obviously we can point to the law of truly large numbers. Time scales of tens of millions of years or more are kind of unfathomable. That incredible duration makes the astronomically unlikely possible.
